The data scientist creativity paradox
Take a standard 52 deck of cards and draw two cards. Can you find something in common about these two cards?
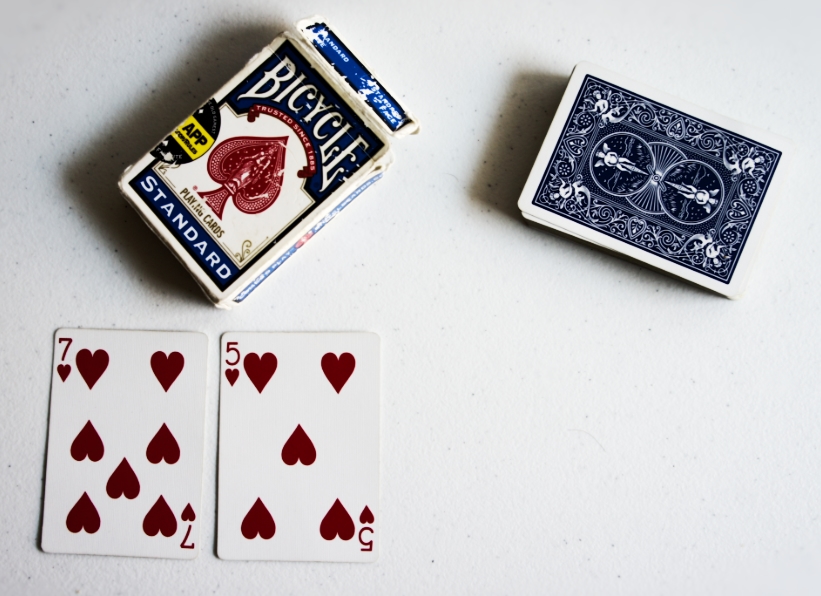
Can you conclude from this observation that someone sorted the deck in a special way?
You may not be certain. Let’s pick two more pairs of cards.
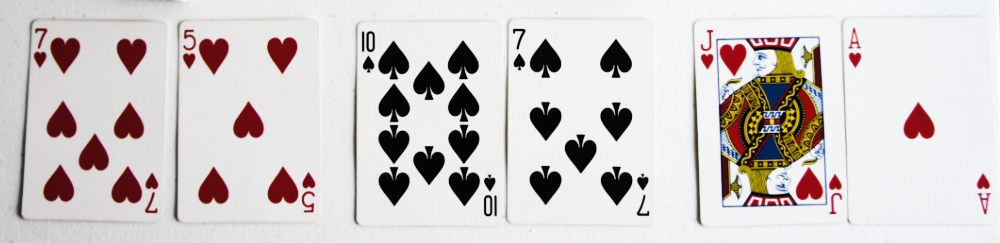
Now that you have three data points, what is your conclusion: Someone arranged this deck in a special way or not?
That’s what most data scientist are doing in a daily basis.
Given a dataset, we’re trying to find surprising correlations. Most of the time, like with these cards, we don’t exactly know what we are looking for.
And, looking at the data, we see it: each pair of cards has the same suit! So we define an hypothesis:
“Each pair of cards of this deck has the same suit”.
Finally, we have to verify if the first intuition is statistically significant.
The probability to have two cards with the same suits is 1⁄4. As a consequence, the probability to have 3 consecutive pairs with the same suit is a bit less than 2%. This is a meaningful discovery:
Every pair of cards of this deck has the same suit with a p-value of 0.02.
Except it is not. This deck has nothing particular, you only detected your own enthusiasm to find a result.
The data scientist imagination paradox
This is my new favorite imagination game, I take a deck of card and I try to find a link between each pair of card.
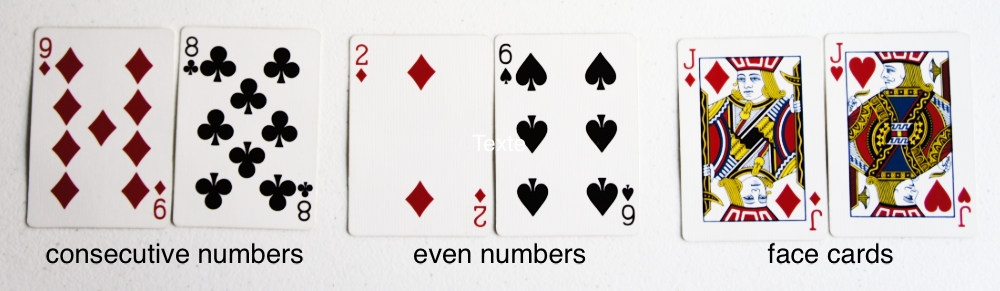
With some training, I now manage most of the time to find something in common with every single pair of card.
As so, finding something in common in a pair of cards has nothing particular in my own case.
The data scientist imagination paradox. The more imaginative you are, the less significant will be your observations.
Let’s imagine there is a finite amount of patterns N on data. And let’s suppose that all these patterns are all as likely to happen on our data by chance. In other words, there is a 1/N chance to observe this pattern on random data.
And now let’s have two data scientists :
- Captain Obvious is not very creative, the amount of idea he can think of is
C, way belowN. - Marvin is very creative, he can think at
100Cideas.100times more ideas than Captain Obvious
Captain Obvious and Marvin look at our data and a pattern in the data after looking at K samples. Which one of them should we follow?
Let’s compute the probability that they detected something particular in random noise (assuming all the patterns are independent).
Captain Obvious : $C \times \left(\frac{1}{N}\right)^K$
Marvin : $100 \times C \times \left(\frac{1}{N}\right)^K$
Since Marvin is 100 more creative, he is 100 times more likely to discover something in noise!
When we see a pattern in data, we underestimate all the other patterns that would have surprised us the same way.
The Scientific method
Are creative people condemned to try to be less creative? Hopefully not!
The solution is to apply the scientific method:
- 1. Ask a question
- 2. Construct a hypothesis
- 3. Test with an experiment
- 4. Draw conclusions
Unfortunately, a lot of data analysis apply it the wrong way:
- 3. Test with experiments
- 2. Construct a hypothesis
- 1. Ask a question that match our hypothesis and experiments
- 4. Draw conclusion
If you decide on your hypothesis after making your experiments, you are confirming your bias, not learning.
Let’s go back on the deck of card. After making the hypothesis “Each pair of cards of this deck has the same suit”.. I need to draw 3 new pairs of cards as an experiment to confirm.
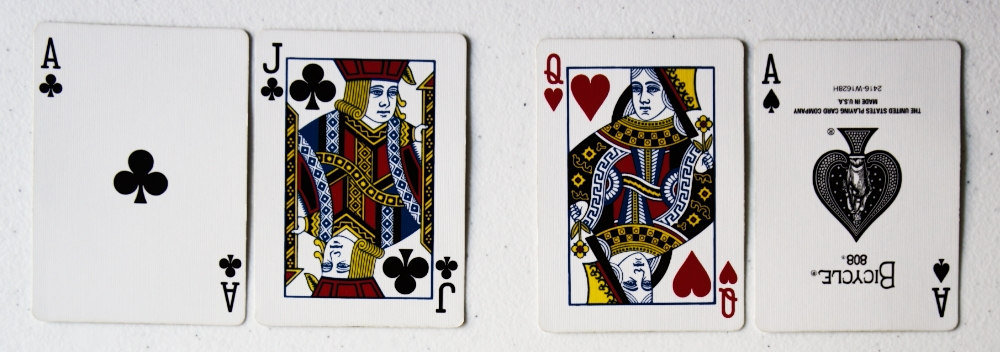
And I can conclude that my hypothesis was wrong.
You always need to validate your hypothesis on data you’ve never looked at before.